

Python培训
400-996-5531
相关依赖:
Pandas: 操作dataframe数据的模块。
Zipline介绍:
Zipline是一个Python的交易算法库。这是一个事件驱动的系统,同时支持测试和现场交易。Zipline现在被用作著名量化平台Quantopian的回测引擎。
Zipline特点:
易用性:Zipline能让你免去设计程序的烦恼,你可以专注于算法的发展。
自驱动性:Zipline已经为用户准备好了许多常用的指标。
融合性:Zipline的产出结果是通用的dataframe格式数据,易调用。
Zipline安装:
可以使用pip进行安装:
$ pip install zipline
又或者通过Anaconda。
$ conda install -c Quantopian zipline
快速入门示例:
新建Python脚本,写入以下内容,命名为dual_moving_average.py。
from zipline.api import order_target, record, symboldef initialize(context): context.i = 0 context.asset = symbol('AAPL')def handle_data(context, data): #预留出300天窗口 context.i += 1 if context.i < 300: return #计算滑动平均 short_mavg = data.history(context.asset, 'price', bar_count=100, frequency="1d").mean() long_mavg = data.history(context.asset, 'price', bar_count=300, frequency="1d").mean() #交易逻辑设定 if short_mavg > long_mavg: # order_target orders as many shares as needed to # achieve the desired number of shares. order_target(context.asset, 100) elif short_mavg < long_mavg: order_target(context.asset, 0) #保存数据 record(AAPL=data.current(context.asset, 'price'), short_mavg=short_mavg, long_mavg=long_mavg)
上述程序非常容易理解,其实最核心的部分就是handle_data()函数,更具体一点就是交易逻辑的设定,在这里有很大的自由度,可以引进例如ta-lib等计算各种指标的工具,设计更复杂的交易逻辑。
注意:当用户在中国地区时,必须要上vpn,并且在terminal里配置proxy代理。
接着,在terminal中输入:
$ zipline ingest$ zipline run -f dual_moving_average.py --start 2011-1-1 --end 2016-1-1 -o dma.pickle
第一条命令获取数据,第二条命令使用Zipline CLI进行回测。结果保存在本目录下的dma.pickle中。
按上述命令操作后,在本目录便会出现一个dma.pickle的文件。这种格式的文件可以被pandas读取为dataframe,以便后续分析。我们写下来作交易结果的可视化。 在新的script中写入下面代码读入pickle文件,并查看结构:
import pandas as pdperf = pd.read_pickle('dma.pickle')perf.columsperf.head(5)
然后便携一个最基本的可视化程序:
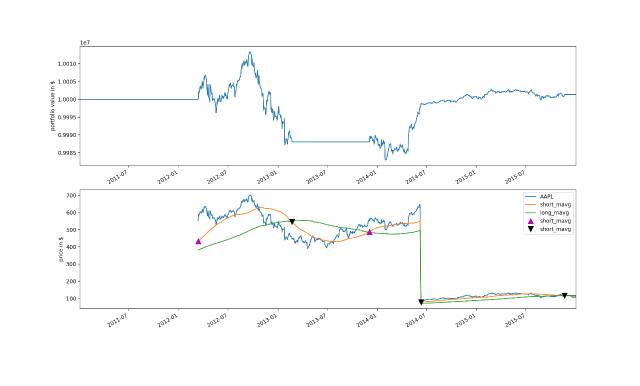
import matplotlib.pyplot as pltax1 = fig.add_subplot(211)perf.portfolio_value.plot(ax=ax1)ax1.set_ylabel('portfolio value in $')ax2 = fig.add_subplot(212)perf['AAPL'].plot(ax=ax2)perf[['short_mavg', 'long_mavg']].plot(ax=ax2)perf_trans = perf.ix[[t != [] for t in perf.transactions]]buys = perf_trans.ix[[t[0]['amount'] > 0 for t in perf_trans.transactions]]sells = perf_trans.ix[ [t[0]['amount'] < 0 for t in perf_trans.transactions]]ax2.plot(buys.index, perf.short_mavg.ix[buys.index], '^', markersize=10, color='m')ax2.plot(sells.index, perf.short_mavg.ix[sells.index], 'v', markersize=10, color='k')ax2.set_ylabel('price in $')plt.legend(loc=0)plt.show()
结构如下图所示:

前面一段没有交易是因为我们取的长期移动平均是300天,所以前面是空白。后面则真实反映了交易情况。上下箭头各表示了买入和卖出。
另外值得一提的是一些重要参数,比如夏普率,alpha收益,beta收益,最大回撤等待都可以在从pickle文件读取出来的dataframe里找到。到此为止,一个策略的效果就被验证完毕了。当然,如果要有其他需要计算的参数,仍然可以用record()函数进行添加,灵活度非常高。可以说zipline做回测试非常方便的了。
填写下面表单即可预约申请免费试听! 怕学不会?助教全程陪读,随时解惑!担心就业?一地学习,可全国推荐就业!
Copyright © Tedu.cn All Rights Reserved 京ICP备08000853号-56  京公网安备 11010802029508号 达内时代科技集团有限公司 版权所有